2. Charts
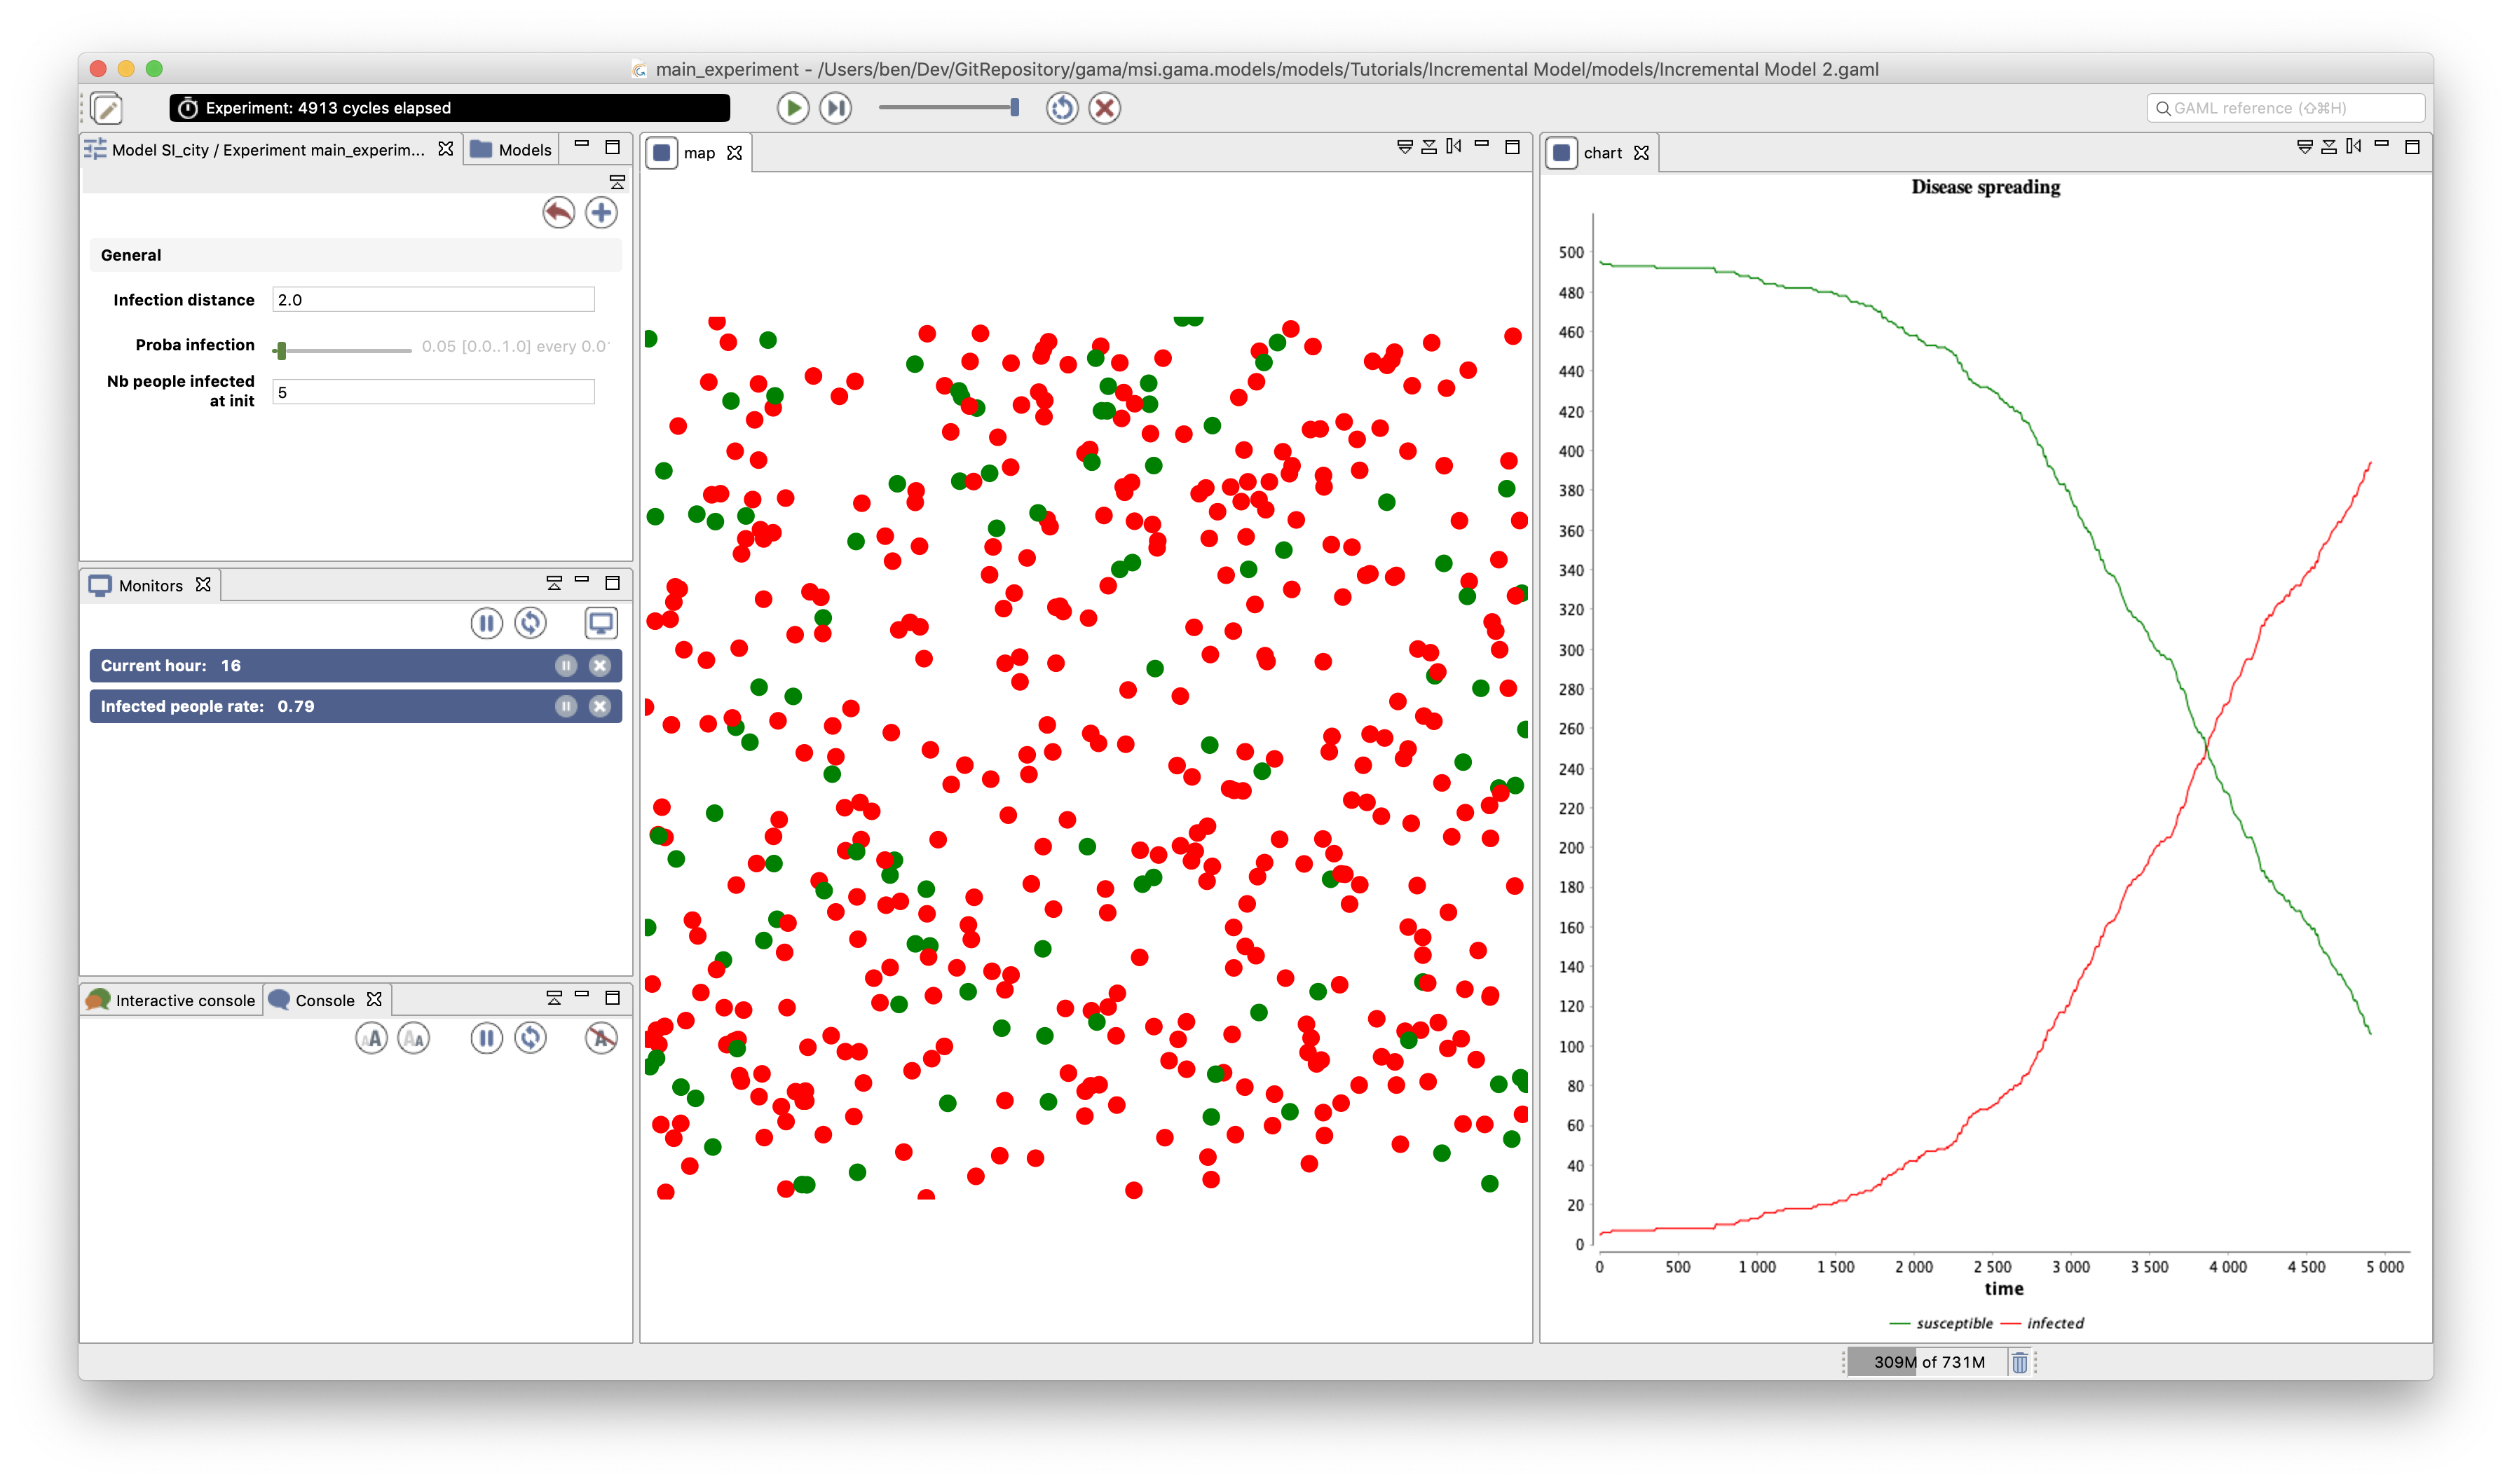
This step Illustrates how to define monitors and charts in GAMA. In addition, it illustrates how to define a stopping condition for the simulation.
Formulation
- Definition of new global variables: current_hour, nb_people_infected, nb_people_not_infected, infected_rate.
- Definition of a monitor to follow the current hour and the nb of people infected.
- Definition of a series chart to follow the number of people infected and not infected.
- Definition of a stopping condition (when infected rate = 1).

Model Definition
global variables
In order to define dynamic variable able to update itself, we use the update facet of variable definition.
Indeed, at each simulation step, all the agents (and the world agent) apply for each dynamic variable (in their definition order) its update expression.
We add 3 new global variables:
nb_people_infected(int): nb of people withis_infectedistrue(use of thelist count conditionoperator that count the number of elements of the list for which the condition is true)nb_people_not_infected(int):nb_people - nb_people_infectedinfected_rate(float):nb_people_infected / nb_people
global{
    ...
    int nb_people_infected <- nb_infected_init update: people count (each.is_infected);
    int nb_people_not_infected <- nb_people - nb_infected_init update: nb_people - nb_people_infected;
    float infected_rate update: nb_people_infected/nb_people;
    ...
}
stopping condition
We add a new reflex that stops the simulation when all the people agents are infected (i.e. if the infected_rate is equal to 1). To stop the simulation, we use the pause global action.
global {
    ...
    reflex end_simulation when: infected_rate = 1.0 {
	do pause;
    }
}
monitor
A monitor allows the modeler to follow the value of an arbitrary expression in GAML. It has to be defined in an output section. A monitor is defined as follows:
monitor monitor_name value: an_expression refresh:every(nb_steps);
With:
value: mandatory, its value that will be displayed in the monitor.refresh: bool, optional: if the expression is true, compute (default is true).
In this model, we define 2 monitors to follow: (i) the value of the variable infected_rate, and (ii) to follow the time in the simulation (we will display the hour day).
As detailed in the dedicated page, GAML language provides a datatype to manage date (with second, minute, hour, day, month and year), and compute automatically the date in the simulation from the global variable starting_date of the simulation and the step value: this value is stored in the current_date global variable. To monitor the current hour, we can access to the hour attribute of this variable (current_date.hour).
experiment main_experiment type: gui {
    ...
    output {
	monitor "Current hour" value: current_date.hour;
	monitor "Infected people rate" value: infected_rate;
	...
    }
}
chart
GAMA can display various chart types, for example:
- Time series
- Pie charts
- Histograms
A chart must be defined in a display: it behaves exactly like any other layer. Definition of a chart:
chart chart_name type: chart_type  {
     [data]
}
The data to draw are defined inside the chart block with the data statement:
data data_legend value: data_value
We add a new display called "chart" and refreshed every 10 simulation steps.
Inside this display, we define a chart of type series:
- "Disease spreading"; background: white; of type series and style spline (no remove the markers)
- data1: susceptible; color : green
- data2: infected; color : red
experiment main_experiment type: gui{
    ...
    output {
	...
	display chart refresh: every(10#cycles) {
	    chart "Disease spreading" type: series style: spline {
		data "susceptible" value: nb_people_not_infected color: #green;
		data "infected" value: nb_people_infected color: #red;
	    }
	}
    }
}
Complete Model
loading...