3. Connections
Formulation
- Mapping the network of connection
Model Definition
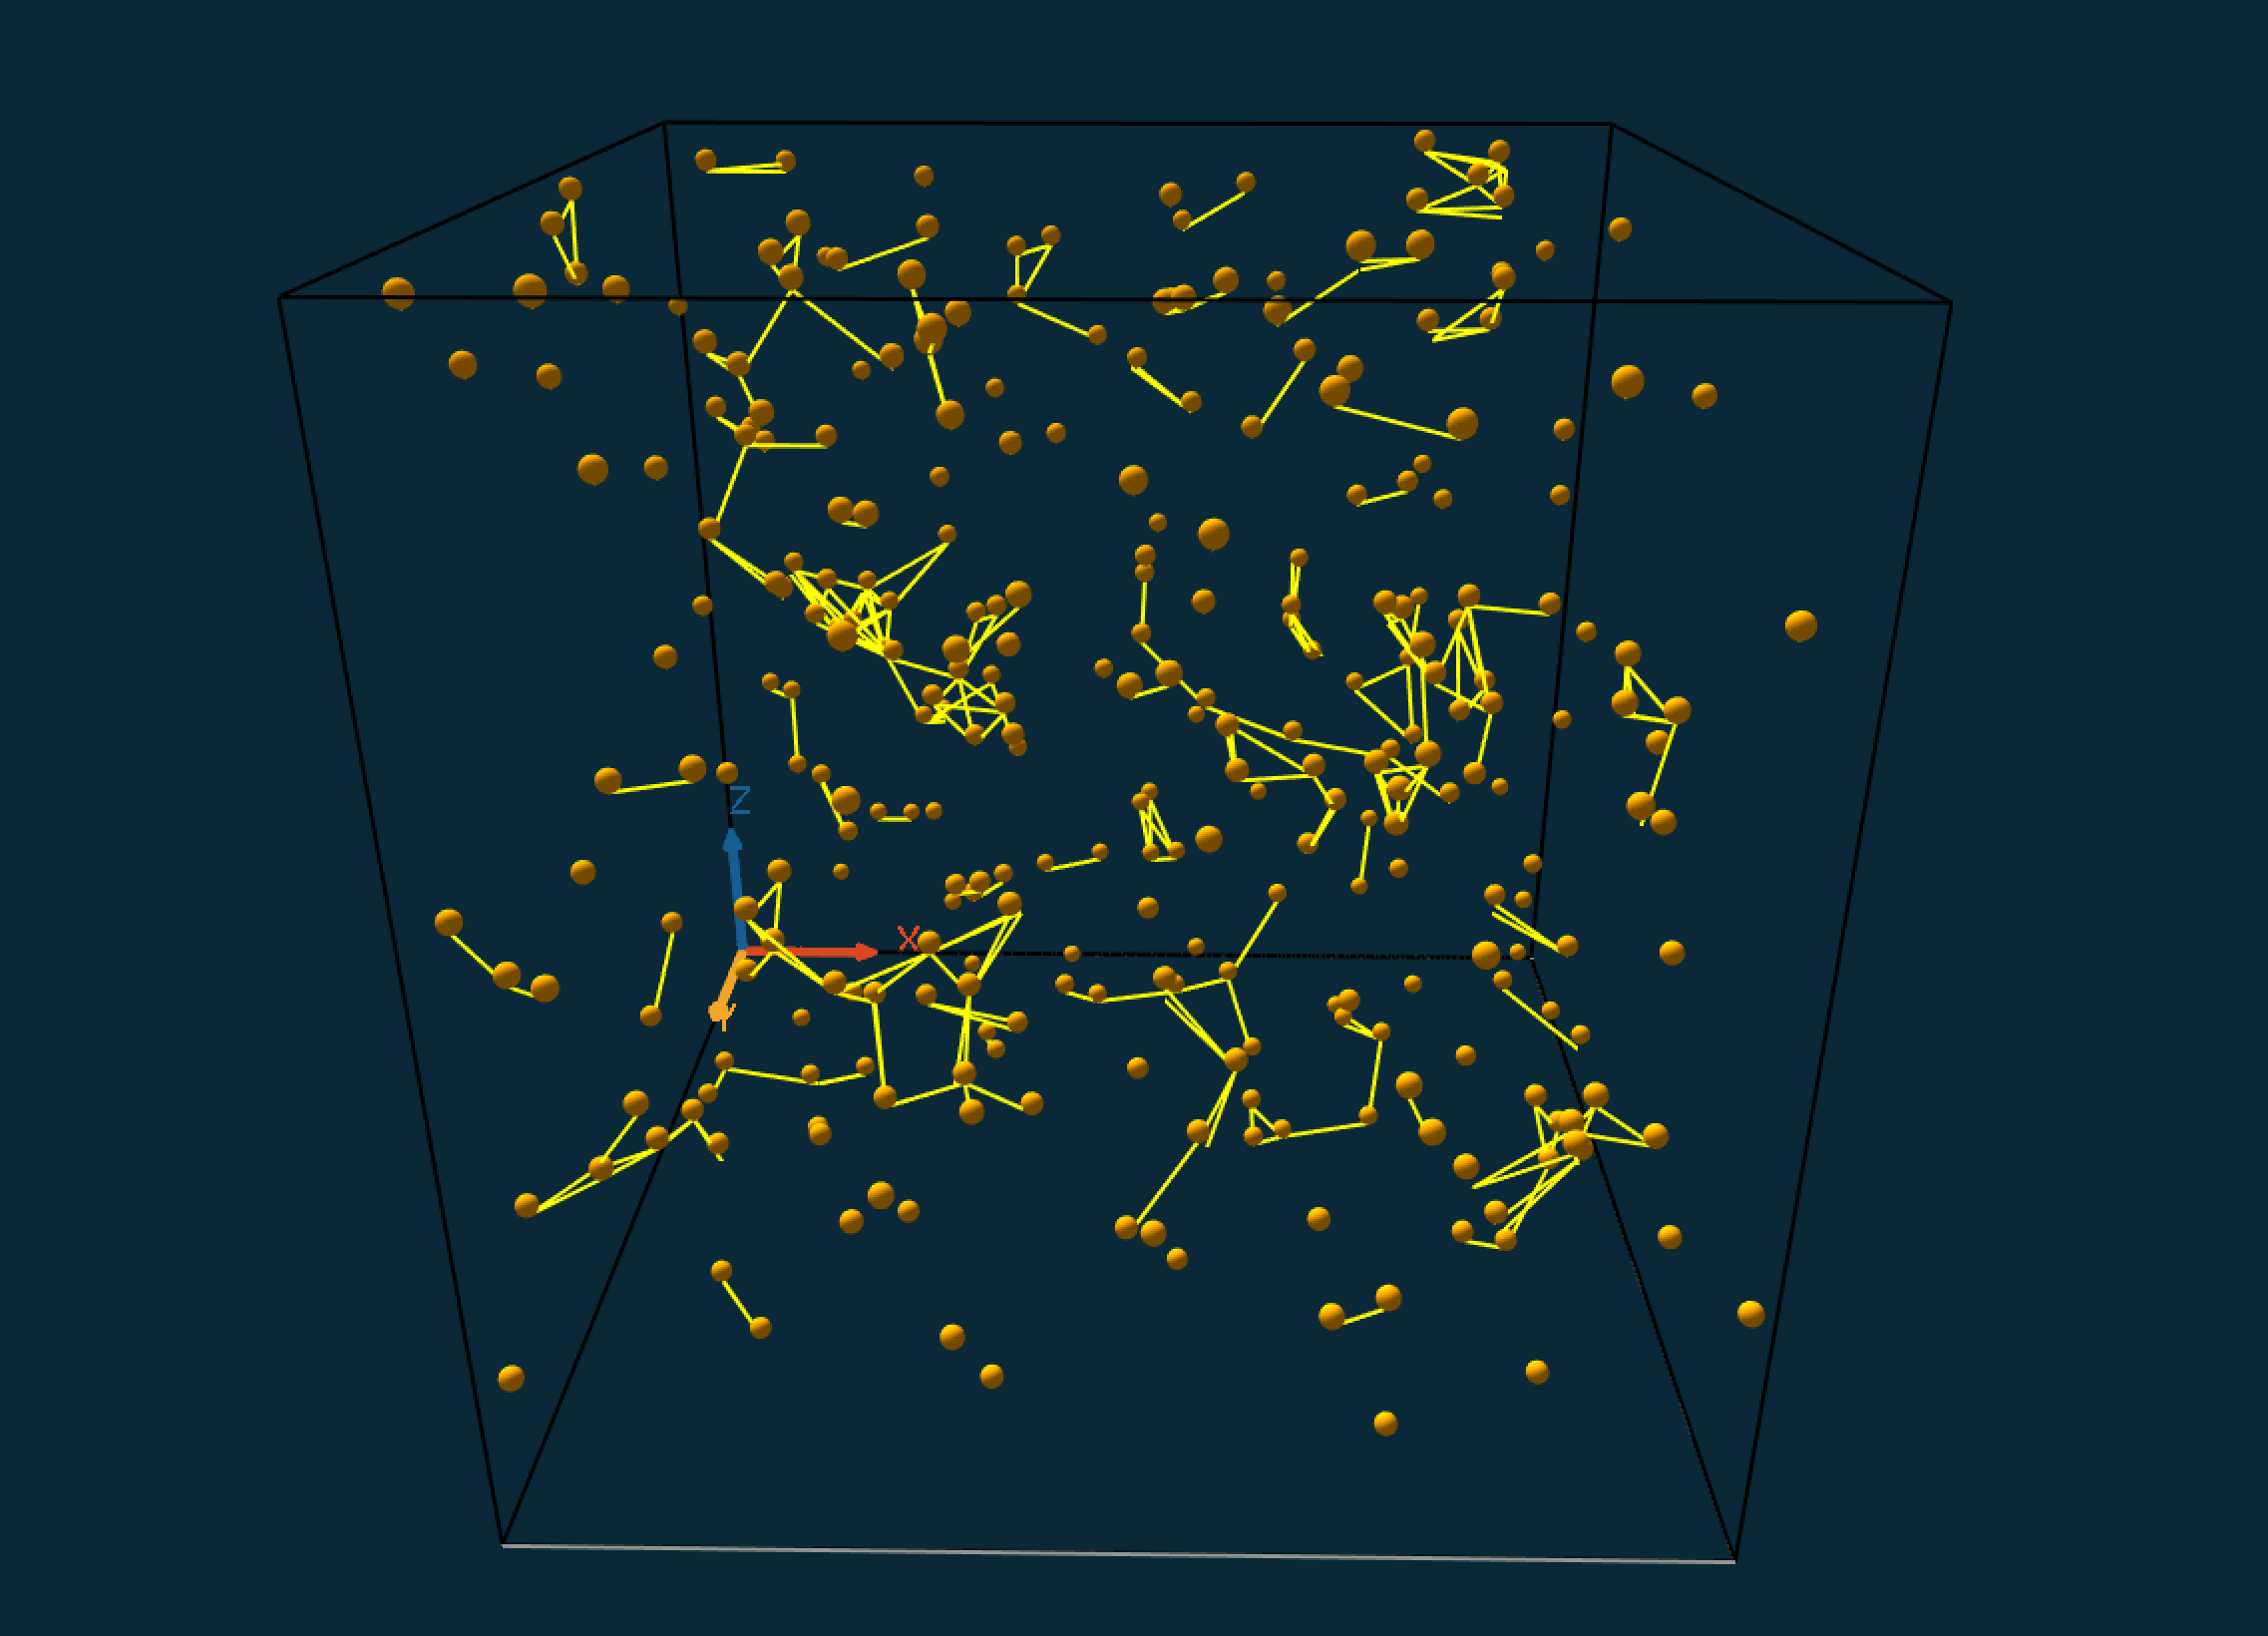
In this final step, we will display edges between cells that are within a given distance.
Cells update
We add a new reflex to collect the neighbors of the cell that are within a certain distance:
species cells skills:[moving3D]{
...
    reflex compute_neighbors {
        neighbors <- cells select ((each distance_to self) < 10);
    }
}
Then we update the cell aspect as follows. For each element (cells) of the neighbors list, we draw a line between this neighbor's location and the current cell's location.
aspect default {
    draw sphere(environment_size*0.01) color: #orange;
    loop pp over: neighbors {
        draw line([self.location,pp.location]);
    }
}
Complete Model
The GIT version of the model can be found here Model 03.gaml
model Tuto3D

global {
    int nb_cells <- 100;
    int environment_size <- 100;
    geometry shape <- cube(environment_size);

    init {
	create cell number: nb_cells {
	    location <- {rnd(environment_size), rnd(environment_size), rnd(environment_size)};
	}
    }
}

species cell skills: [moving3D] {
    rgb color;
    list<cell> neighbors;
    int offset;

    reflex move {
	do wander;
    }

    reflex compute_neighbors {
	neighbors <- cell select ((each distance_to self) < 10);
    }

    aspect default {
	draw sphere(environment_size * 0.01) color: #orange;
	loop pp over: neighbors {
	    draw line([self.location, pp.location]);
	}
    }
}

experiment Tuto3D type: gui {
    parameter "Initial number of cells: " var: nb_cells min: 1 max: 1000 category: "Cells";
    output {
	display View1 type: opengl background: rgb(10, 40, 55) {
	    graphics "env" {
		draw cube(environment_size) color: #black empty: true;
	    }
	    species cell;
	}
    }
}